Operating systems need at least a minimum of maintenance to run properly over the long term. While some important tools are already included from Microsoft, many professionals want or need more powerful and useful tools to help them when using Windows systems.
Thankfully, Microsoft provides numerous tools free of charge that help with analysis, maintenance, and troubleshooting. Some of these tools are useful for everyone in everyday use, while others are only needed in special situations.
There are several reasons why the tools are not included as standard Windows equipment. Due to the sheer number of different functions, the need for these specific tools is often not obvious at first glance, and sometimes the prerequisites for using the tools have to be created first. In this article we’ll explain how to use Microsoft Sysinternal tools so that you can perform necessary maintenance or analyze and troubleshoot problems in Windows optimally and efficiently.
Setting up the Sysinternals tools from Microsoft
In the past, if you wanted to develop system-related tools for Windows, you needed in-depth knowledge of the operating system. That was until 1996 when the programmers Mark Russinovich and Bryce Cogswell programmed diagnostic software for Windows for their company Winternals Software LP. In 2006, Microsoft took over the company and began distributing this software themselves.
Under the name “Sysinternals,” these tools are continually developed and adapted for newer Windows versions such as Windows 10 and 11 and made available for download free of charge. Some of the tools offer a graphical user interface, while others are started via Powershell or the command prompt. Under “Download” you’ll find the individual tools and also the Sysinternals suite, which contains almost all of the 60-plus tools.
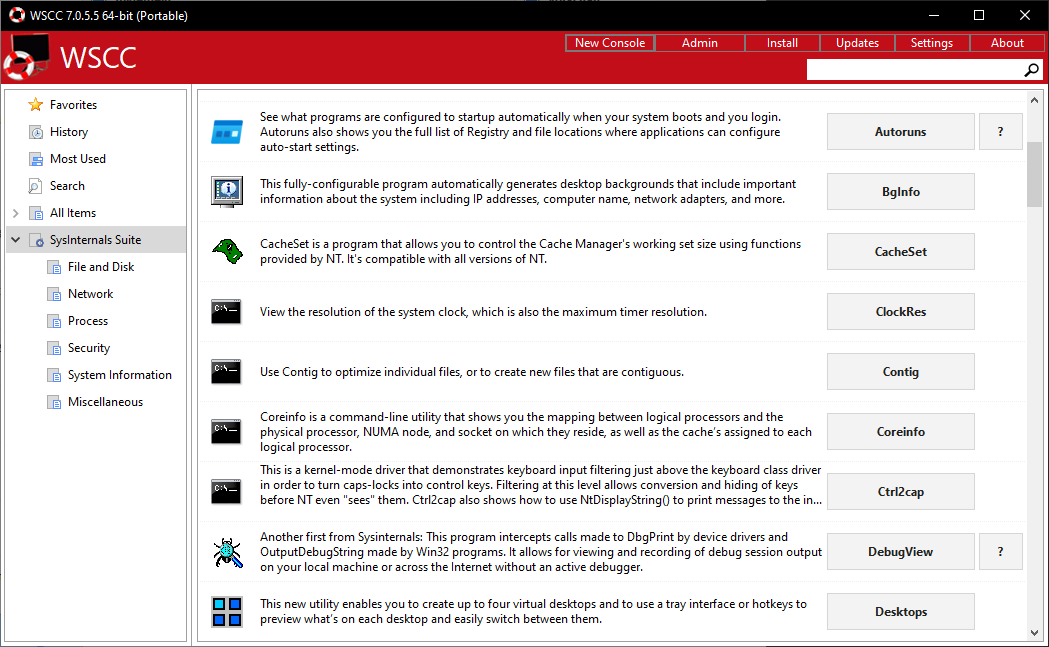
Set up Sysinternals tools conveniently: The Windows System Control Center (WSCC) downloads the tools and provides short descriptions.
IDG
However, we recommend the Windows System Control Center (WSCC) for installing the Sysinternals tools. It downloads either all or only the desired programs from Microsoft and also takes care of updating these tools in the future.
Once you download WSCC, place it into a folder with a short name and no spaces or special characters, for example “C:WSCC” or “C:ToolsWSCC”. This makes it easier to use the command line tools.
When you start it for the first time, you’re able to set some options. However, it’s usually sufficient to simply confirm with “OK“. In the “Software Sources” window, select the tool packages for installation. Click on “OK” and then on “Yes“. In the next window, you can specify the installation path. Accept the default “.\ SysInternals Suite” by clicking on “OK“. Then click on “Install” to download all tools or you can remove the check marks from those you don’t need.
WSCC shows the category “Sysinternals Suite” in the tree view on the left side of the window and groups such as “File and Disk“, “Network” and “Security” below it. The list with the associated tools appears on the right side of the window. Next to each program there is a button to start the tool and sometimes a “?” button that leads to the help file.
The Sysinternals suite contains some programs with an additional “64” in their name. These are the 64-bit versions. In WSCC you can set a check mark in front of “Launch the 64-bit version if available” via “Settings” under “General“. Then, if available, the 64-bit tool will be started.
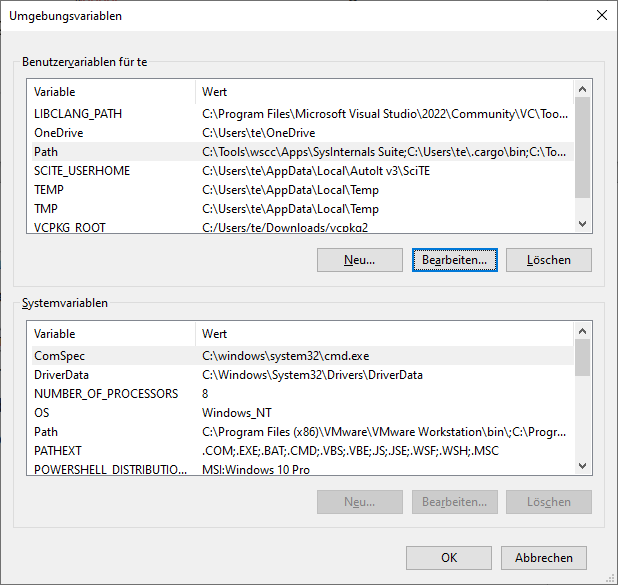
Configuration for the command line: So that the tools can be started in the Powershell or command prompt without specifying a path, configure the environment variable “Path“.
IDG
Configuration for the command line tools
You can start each tool via the Windows Explorer or the command prompt directly from the download directory. In Powershell or Command Prompt it’s necessary to put the directory in front of the program name. This can be avoided by including the folder in the environment variable “Path“. For the configuration, search for environment variables in the “Settings” (Win-I) and click on “Edit environment variables for this account” in the search result. Click on “Path” under “User variables” and then on “Edit“. Use “New” to add the directory in which the Sysinternals tools are located. These can then be started simply by their name.
Process Explorer: What is currently running on the PC?
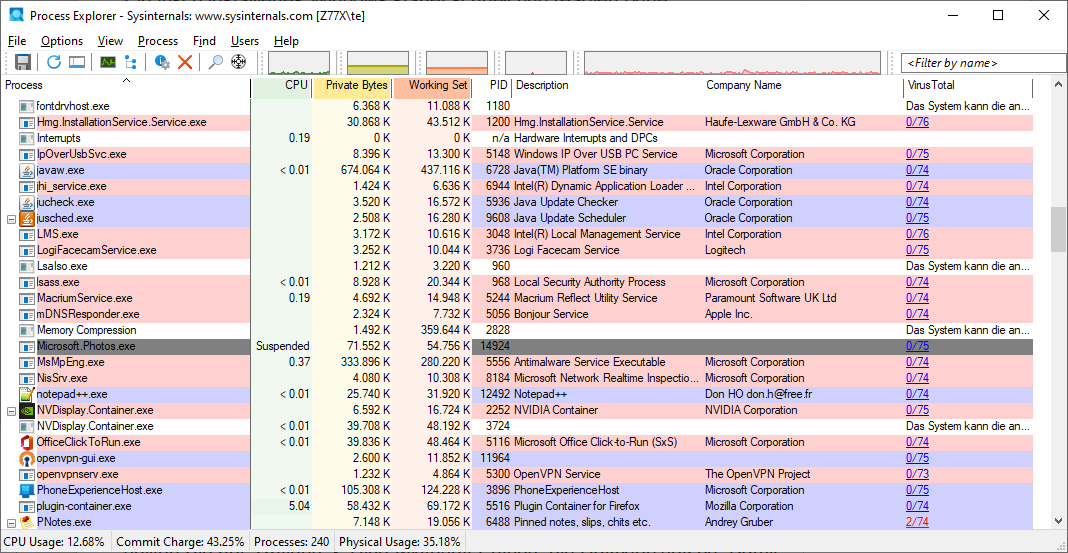
Process Explorer: The tool shows all running processes with names and descriptions and provides information on CPU load and memory requirements.
IDG
While your computer is running, applications that you have started yourself as well as numerous background processes and services are running on your computer. The Windows Task Manager, which can be started with Ctrl-Shift-Esc, shows all of the applications currently running on your computer. When Task Manager is open under Windows 10/11, first click on “More details” at the bottom left and then go to the “Details” tab to see a list of all running programs. Windows 11 users from version 22H2 onwards can just directly click on “Details” in the left-hand pane.
The Sysinternals tool Process Explorer (Procexp.exe, Procexp64.exe) offers even more functions than the Windows Task Manager. The program shows you what is currently happening on the PC through colored backgrounds. Processes that have just been started are highlighted in green, those that are being terminated appear in red.
By clicking on the column headers, this list can be sorted by name, processor load (“CPU”), and memory load (“Private Bytes”). This allows you to find applications that occupy a lot of main memory or place heavy demands on the processor.
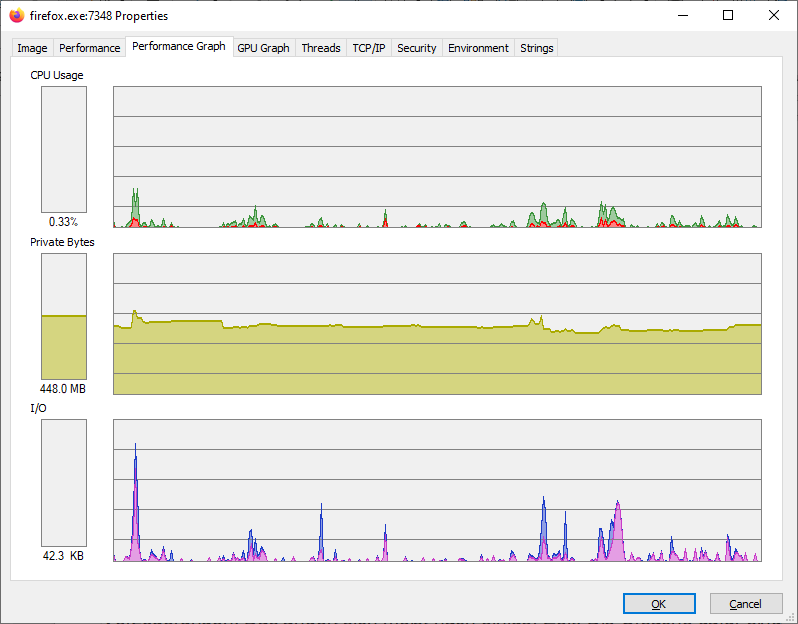
Clicking on “Properties” in the context menu provides more detailed insights. The tabs “Performance Graph” and “GPU Graph” provide you with a graphical overview of the processor and memory activities over a longer period of time. And the “TCP/IP” tab shows you which network resources an application is currently accessing.
If a process crashes, it can be terminated via “Kill Process” under the context menu item or restarted via “Restart“. Be aware however that this only works if you have the necessary access rights. If not, go to “File -> Run as Administrator” to start Process Explorer with the necessary rights.
Dangerous processes?
If certain processes seem suspicious, go to “Search Online” in the context menu. This will start an Internet search for the process name in the browser, which will provide you with further information. If you suspect that it is malware, go to “Check Virustotal.com” in the context menu. The first time you call it up, you’ll need to confirm the terms of use of www.virustotal.com. To test all running programs, go to “Options -> VirusTotal.com -> Check VirusTotal.com“.
In the column “VirusTotal” you’ll be able to see the results of the virus scan. If a program shows “0/75”, for example, you can probably feel safe classifying classify the file as harmless. If “1/75” appears, one of 75 virus scanners has found a suspicious file. Click on the Virustotal result to open the test report in the browser. If only one or two virus scanners have reported anomalies, you can assume that they have detected a virus by mistake — a false alarm. If there are more, it could also be malware. In this case, click on “Behavior” or “Community” on the Virustotal website to find out more about the file. If in doubt, uninstall the affected program and thoroughly scan the system with up-to-date antivirus software.
Autoruns: Reduce automatic program starts
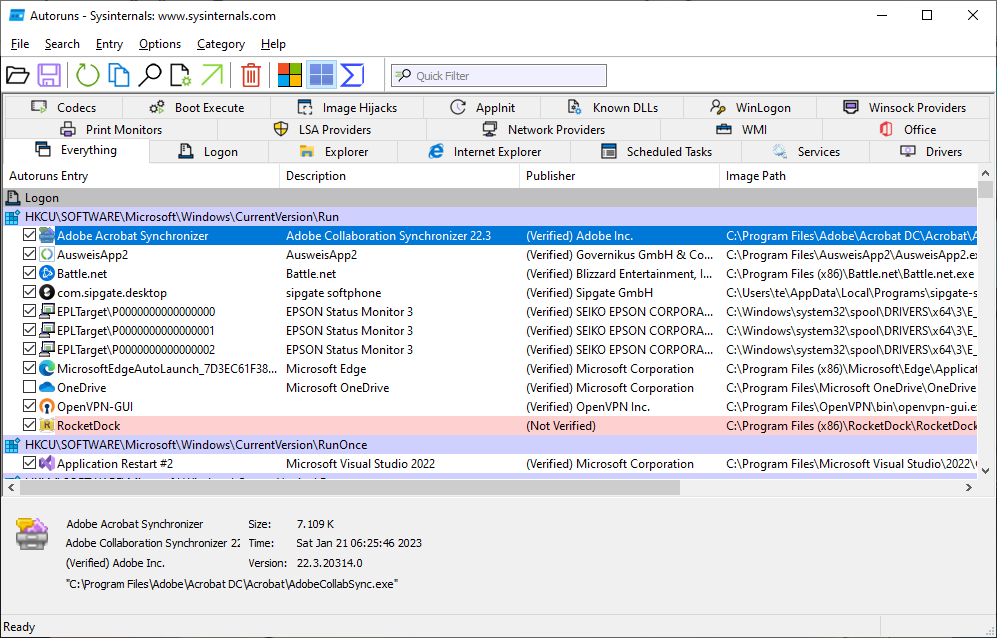
Automatic starts under control: Autoruns shows all autostart ramps. For programs you do not need, simply remove the tick in front of their name.
IDG
As most people know, a freshly installed Windows boots quickly and reacts without delays. Unfortunately, this usually changes over time. The reason for this slowdown is due to programs that configure themselves for automatic start during installation. A program like this can then, for example, check for updates or wait for events in the background. However, this delays the Windows start and slows down the system. None of the auto-start programs are really necessary, but they can be useful. You must therefore weigh up in each case whether an auto-start program is important to you and whether you want to accept a delayed system start for it.
Sysinternals-Autoruns
Sysinternals-Autoruns (Autoruns.exe, Autoruns64.exe) lists all auto-start ramps and can also display and manage extensions for Windows Explorer and Microsoft Office.
After starting, the tool shows several tabs for the different areas. You’ll find that the most practical tab is the “Everything” tab which displays everything together. The list is quite long, but can be limited via “Options -> Hide Microsoft Entries” to hide products that do not originate from Microsoft and only show software that was added later from other manufacturers.
Remove the ticks from all entries that you do not need—this does not delete anything. If it turns out later that a program should be started automatically after all, you can always check the box again.
Use “File -> Run as Administrator” to start Autoruns with increased rights. As a rule, this is not necessary unless, for example, system services are to be switched off under “Services“. However, caution is advised here. Do not switch off Microsoft services, because this can lead to malfunctions.
Save and compare
After you install some software on your computer, new auto-start entries will probably appear. To avoid having to search for them, save the current state in a file via “File -> Save“. Later, the saved state can be compared with the current configuration via “File -> Compare“. The tool highlights new entries in green, deleted entries appear in red.
Examine processes more closely
Sometimes it is not clear which program is hidden behind an auto-start entry and what its function is. As with Process Explorer, by right-clicking on your mouse, you can select “Search Online” and thus start an Internet search in the browser for the process name.
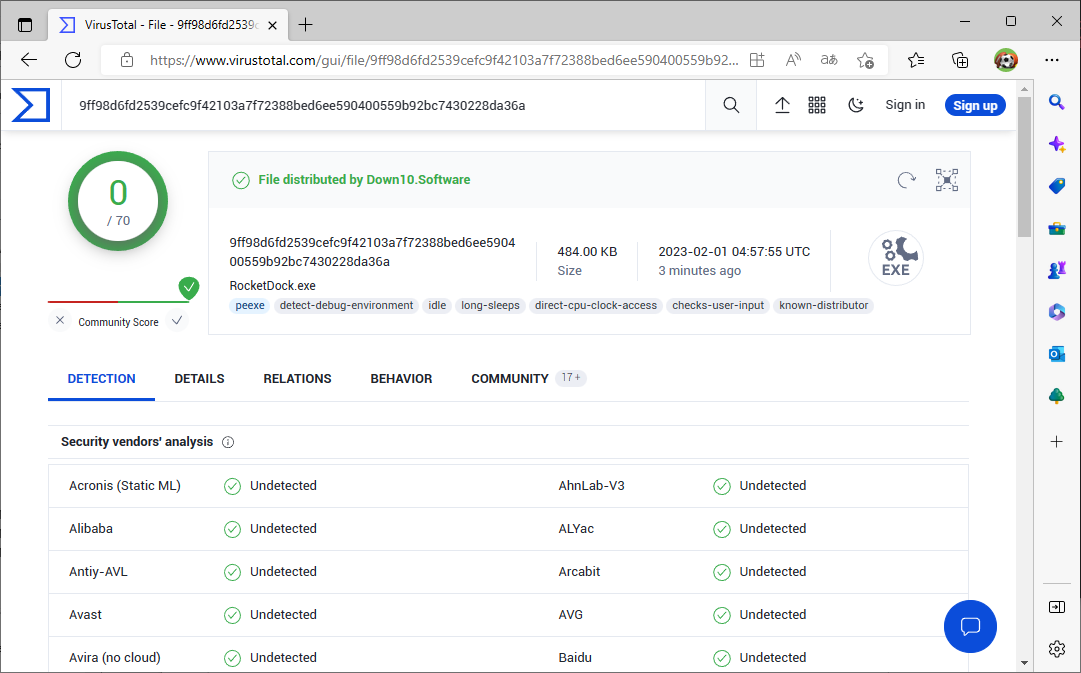
Check security: Send suspicious files to Virustotal.com. The result shows whether one or more virus scanners find malware in the file.
IDG
You can also carry out a security check, similar to Process Explorer, via the context menu item “Submit File to VirusTotal” or “Check VirusTotal.com“. If Virustotal reports a lot of virus detections, that subsequent program should be examined more closely and, if in doubt, deleted or renamed.
Process Monitor: Examine the behavior of programs
A virus scanner can detect malware in a program or classify it as dangerous because of its behavior. However, you can also examine which individual files, registry entries, or network resources a program accesses on your own and thus discover any undesirable behavior.
This type of information can be determined with the help of the Process Monitor (Procmon.exe, Procmon64.exe). However, this is not an easy task, because almost all programs constantly access the hard disk or the network, and it’s difficult to filter out the relevant information from the masses of data.
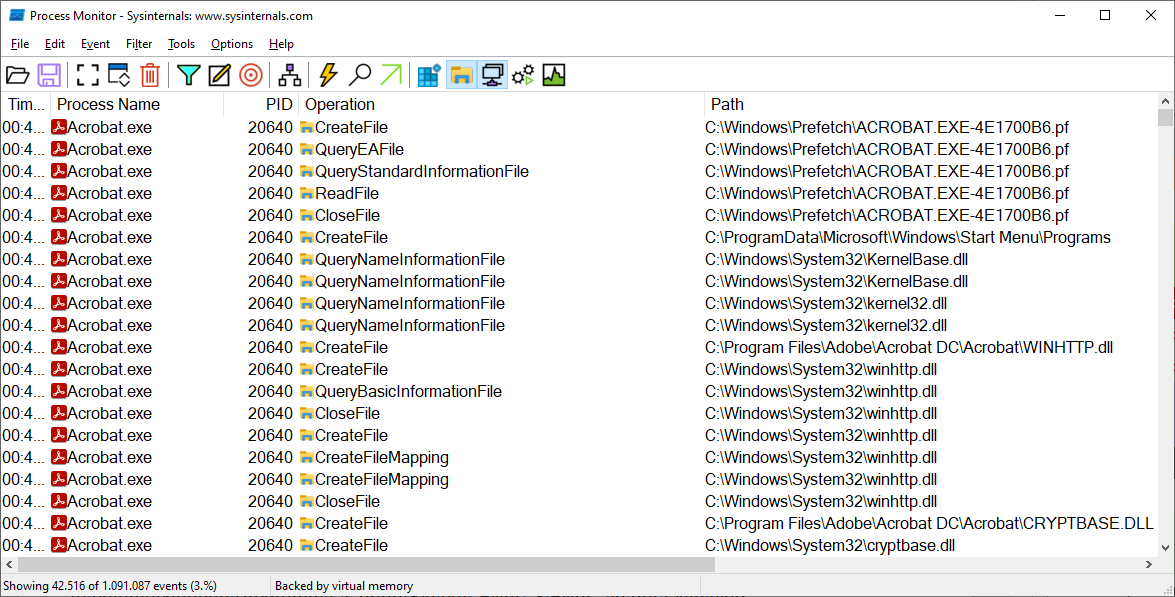
Process Monitor: The tool shows which system resources a program is accessing. For example, registry, file and network accesses can be determined.
IDG
Monitoring begins immediately after the Process Monitor is started. You can stop the recording after a short time with the key combination Ctrl-E. The program window shows a chronological list of accesses from all active programs. Under “Process Name” you’ll find the name of the program that performed an action, under “Operation” the action. For example, “RegQueryValue” means that the program has queried a value from the registry.
A filter can be used to examine a specific software. Open the program you want to examine, click on the icon with the target (“Include Process from Window”) in the Process Monitor, hold down the left mouse button and drag the crosshairs to the window of the program you want to examine. Go to “Filter -> Filter“. There should already be some entries in the list and you can, for example, exclude Procmon.exe itself from the examination. At the beginning is the line “PID is [ID] include”, where “[ID]” is the process ID of the selected program. In the main window of Process Monitor, activate the recording with the key combination Ctrl-E.
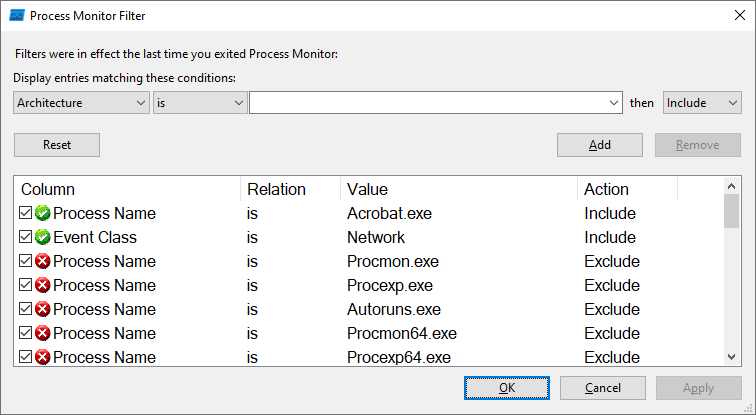
Create a filter for Process Monitor: Use a filter to restrict logging to events that are important to you, such as network access.
IDG
For an alternative configuration, go to “Filter -> Filter” and click on “Reset“. Under “Display entries matching these conditions” select the entry “Process Name“. To the right, enter “is” and after it the name of the program you want to examine, including the file name extension “.exe“. At the end of the line, select “Include“. Then you’ll want to determine the program name, for example, via Process Explorer. If necessary, define further filters such as “Event Class is Network include” if you’re only interested in network access, or “Event Class is File System include“. Click on “Add” and finally on “OK“.
After you have set your filter selection, delete the events recorded you have so far with Ctrl-X and start the recording again with Ctrl-E. The area displayed in the event list can also be controlled via the five buttons in the right-hand area of the toolbar.
Tip: The Sysinternals tool Sysmon can be used to log all or selected system events that may indicate malicious code or hacker activities.
PS tools: Command line tools that can also be used for remote maintenance
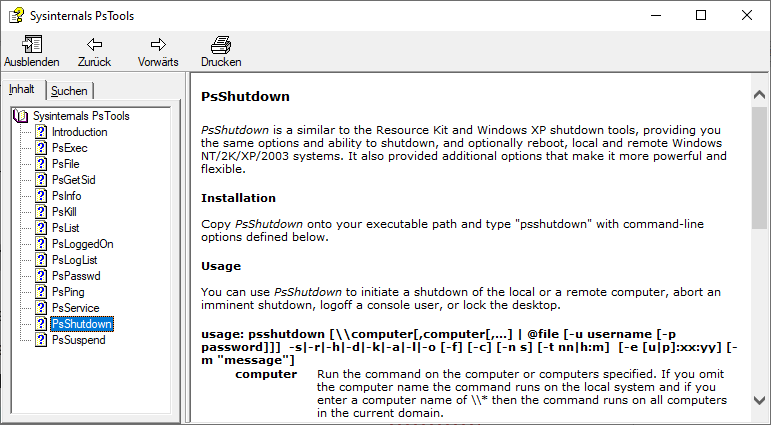
Help for PS-Tools: The help file Pstools.chm contains descriptions of the tools and explanations for the meaning of the available command line options.
IDG
The Sysinternals tools contain several command line tools whose names begin with “PS”. With the PS tools you can display running processes, terminate processes, or shut down the PC. Help on the tools is provided in the file Pstools.chm.
The tools are particularly interesting because they can be used to remotely control other PCs in the network. On the target PCs, you must execute the following three command lines in a command prompt as administrator and then restart the PC:
sc config RemoteRegistry start=auto
sc start RemoteRegistry
reg add HKLM\SOFTWARE\Microsoft\Windows\CurrentVersion\Policies\System /v LocalAccountTokenFilterPolicy /t REG_DWORD /d 1 /f
Also make sure that you can access network shares via Windows Explorer and that file and printer sharing is activated.
All tools work on the local PC if you do not specify any other options. For remote access, the tools will require the IP address or name of the PC you want to access. The general form of the call is
tool.exe \[IP] -u [Benutzer] -p [Passwort] [weitere Optionen]For tasks that do not require administrative rights, set the name of a standard user to “[user]”, otherwise use an account that has administrative rights. For example
psexec \[IP] -u [Benutzer] -p [Passwort] powershell.exeYou can use a Powershell interactively on the other PC. The command for that is:
psshutdown -r -t 10 \[IP] -u [Benutzer] -p [Passwort]The remote PC will restart after 10 seconds.
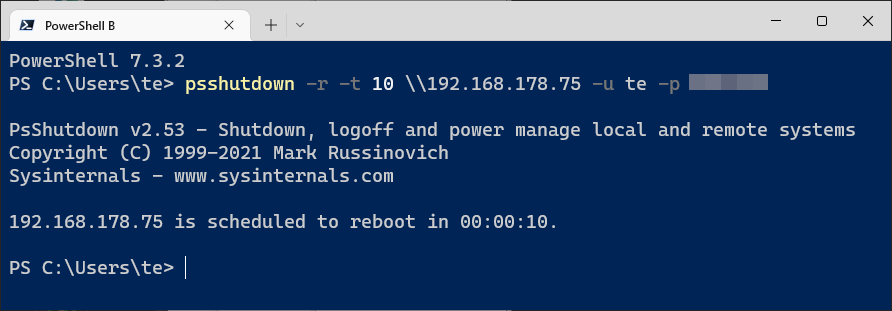
Remote shutdown: With the tool Psshutdown, a PC can be restarted via the network. The target PC must be configured for remote access.
IDG
Handle: Unblock blocked folders
Sometimes folders or files cannot be deleted or renamed. The error message then reads “The action cannot be completed because the folder (or a file in it) is open in another program“. A similar message is received when you’re trying to eject a USB drive but an open file is preventing it. Unfortunately, Windows does not usually indicate in which program exactly the file or folder is open. The Sysinternals tool Handle Viewer (handle.exe, handle64.exe) is a bit more talkative. Run it in a Powershell or command prompt that you start with administrative rights. You can call the tool with:
handle C:[MeinOrdner]Handle Viewer will display the complete path to the affected folder or file for the placeholder. It also outputs the name of the program, its process ID, and the handle ID. If the program is still running, you can then close it to stop the error message.
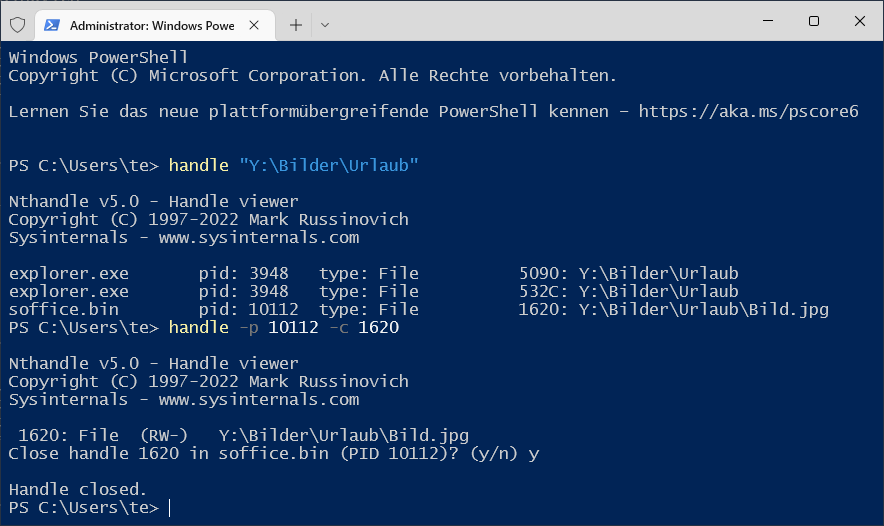
Who is blocking a file? Handle shows which process has just opened a file exclusively. If necessary, the file handle can also be closed.
IDG
If the programme has crashed in the background, close the handle by entering the command:
handle -p [Prozess-ID] -c [Handle-ID]Once you do, only the handle will be closed, the program itself usually continues to run. For unsaved files, however, this will probably result in data loss so be careful.
This article was translated from German to English, and originally appeared on pcwelt.de.


